Interface
The main application interface is effectively divided into three sections, the Tab Bar located at the top, Options & Functions related to the current tab in the middle, and a Monitor Pane located at bottom.
The Tab Bar
The currently active tab determines which log is visible to the user. A detailed explanation of each protocol tab is given on the respective MIDI Tab, OSC Tab and Gamepad Tab pages.
A small white indicator in each tab (a white dot to the right of the protocol name) offers a quick visual cue that both logging is enabled and that data is being received.
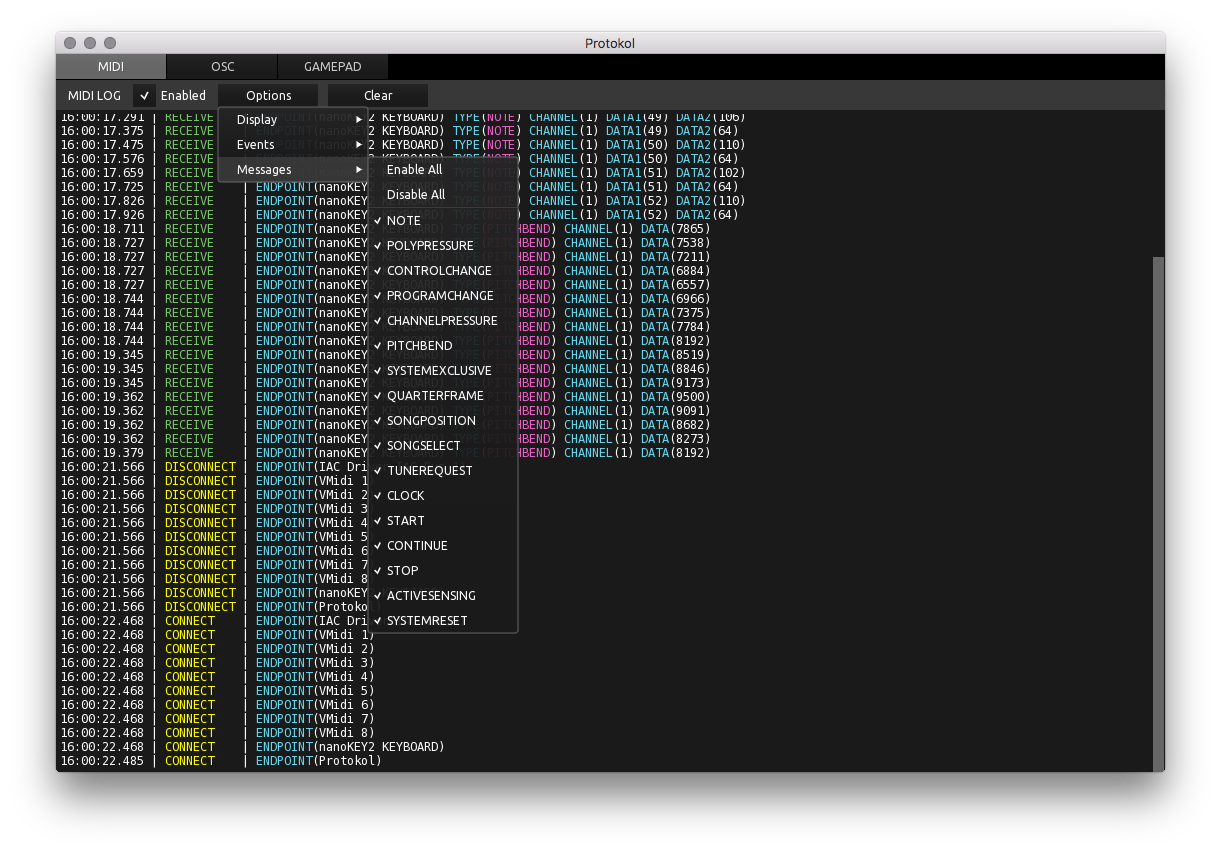
Options & Functions
Determines how incoming information is logged and displayed in the Monitor Pane. Activating 'Enabled' starts logging. Deactivating 'Enabled' ends logging.
Pressing 'Clear' deletes all previously logged information from application memory and erases the Monitor Pane.
A small white numerical indicator to the right of the options (0.00 by default) shows how many messages are being logged per second.
Specific 'Options' are explained in detail on the respective protocol tab pages: MIDI Tab, OSC Tab and Gamepad Tab.
The Monitor Pane
The largest area of the interface is dedicated to displaying the log output, the Monitor Pane. By default the log is blank until the 'Enabled' button for the currently selected tab is activated.
Messages and events are displayed as a scrolling list and can be saved as a text file or copied to clipboard. The number of log lines to be displayed and kept in application memory can be adjusted in Preferences.